Environmental Assessment
Volume E-5.3
Tailings Facility
Land Use
Ambatovy Project
209
January 2006
CROPWATER software gives theoretical water needs for each decade (three
decades / month), per hectare, based on details of rice transplantation.
A coefficient of efficiency of the water network was then applied by Centre
National d’Etudes et D’Applications du Génie Rural (CNEAGR) based on their
experience in Madagascar (about 40% losses within irrigation channels).
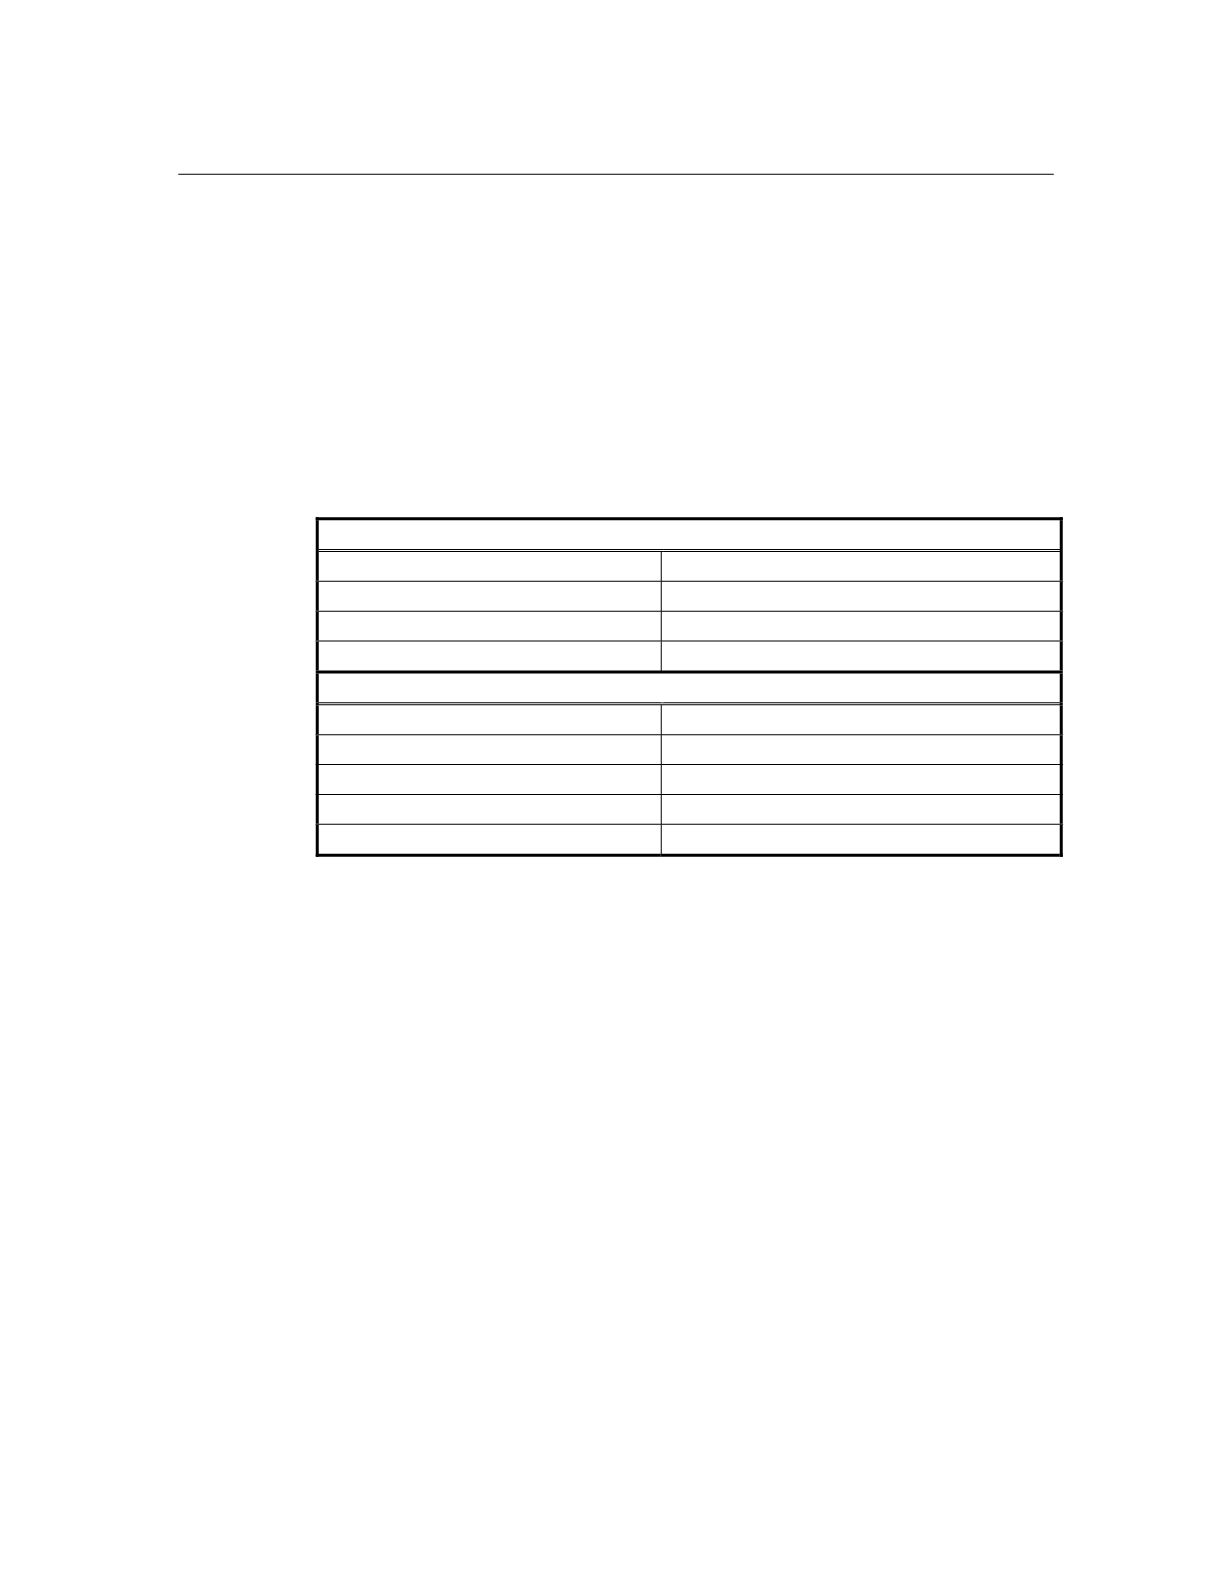
The calculation was made for the dates of rice transplantation provided in
Table 5.3-1.
Table 5.3-1 Rice Seasons by Planting Date
First Season
5 December
Result 1
5 January
Result 2
5 February
Result 3
Water needs for the 1
st
season
S1 = Average (R1, R2, R3)
Second Season
5 July
Result 4
5 August
Result 5
5 September
Result 6
Water needs for the 2
nd
season
S2 = Average (R4, R5, R6)
Water needs for the entire year
S1 + S2
These results per decade and per hectare were then multiplied by the rice surfaces
in each area downstream from the tailings. A percentage of the resulting water
volume requirement was added on to account for other agricultural needs.
5.3.6
Impact Assessment
A linkage diagram for land use is presented in Volume H, Section 9. Potential
impact pathways between the tailings facility and changes in land use exist for:
•
alteration of soils, terrain and vegetation;
•
changes in agriculture in downstream areas due to hydrologic effects;
•
changes in fish habitats and abundance; and
•
changes in wildlife populations and/or distribution.


